Running a fast, repeatable product review lab that actually predicts affiliate conversion rates sounds like a luxury — until you realise it’s a process you can standardise and run in two hours. I’ve run dozens of these at Mediaflash Co to judge gadget launches quickly, cut down review time, and give commercial teams a better read on which products will perform with our audience. Below I’ll walk you through the exact session structure, what to measure, the tools to use, and how to turn two hours of hands-on testing into a conversion prediction that your affiliate or revenue team can act on.
Why a two-hour lab works
Two hours is long enough to get meaningful hands-on impressions and short enough to force focus. The goal is not to produce a definitive lab test or a full technical teardown — it’s to simulate the first 48–72 hours of a customer’s experience and capture signals that correlate strongly with affiliate conversion: perceived value, friction, content-ready moments, and social shareability.
What you’ll need (setup before the session)
- One product (obvious but stick to a single SKU or variant to keep results clean).
- Three team roles: Host/presenter, Technical tester, and Commerce analyst. For small teams these can be dual roles.
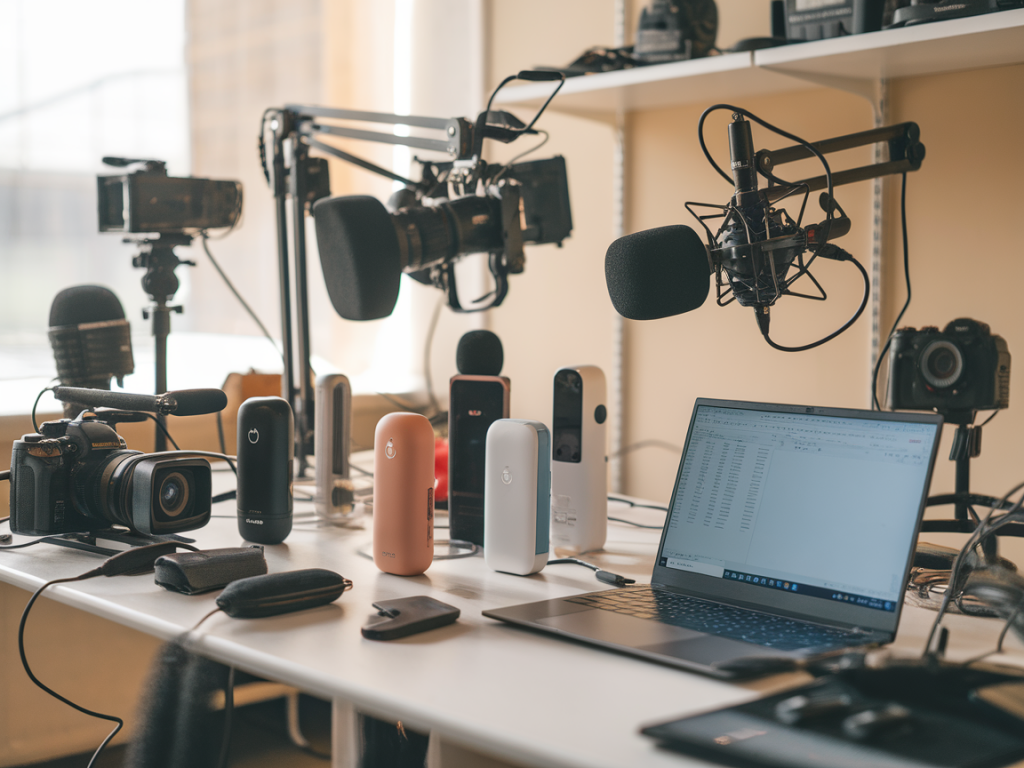
- Recording tools: Phone or capture card for video, simple screen recorder, time-stamped notes app.
- Measurement spreadsheet pre-built — I include the columns I use below in a table.
- Baseline audience data (optional) — past conversion rates for similar categories to ground your predictions.
Session agenda (two hours, minute-by-minute)
Keep strict timing. I run these in a meeting room or a small studio where the host presents and the tester follows a script. Here’s a practical breakdown.
| Minutes 0–10 | Unbox & first impressions (visuals, packaging, initial perceived value) |
| Minutes 10–30 | Setup & basic functionality test (onboarding, out-of-the-box experience, app pairing) |
| Minutes 30–55 | Core use-case test (real-world scenario: filming, calling, streaming, etc.) |
| Minutes 55–75 | Edge cases & pain points (battery, range, error handling) |
| Minutes 75–95 | Content creation pass (b-roll, hero shots, social clips — how easy is it to make affiliate-ready creative?) |
| Minutes 95–110 | Commerce & pricing check (compare to category alternatives, identify value props & hooks) |
| Minutes 110–120 | Scoring & prediction — fill spreadsheet, quick team debrief, final conversion estimate |
The metrics that actually predict affiliate conversion
Not all data is equal. These are the features I prioritise — they map strongly to intent and purchase friction.
- Perceived Value Score (1–10): How compelling is the product’s value proposition in 30 seconds?
- Onboarding Friction (1–10): Lower is better; accounts for setup time, required downloads, account creation.
- Content Yield (clips/minute): How many usable social assets can you capture per minute of filming? High yield means faster influencer/affiliate activation.
- Comparative Price Delta: Difference vs. nearest competitor (absolute and %).
- Trust Signals: Included warranties, brand reputation, certification — binary checklist that influences conversion.
- Likelihood to Recommend (LTR) 1–10: Team gut check after 2 hours.
Scoring template
Use a simple spreadsheet with these columns — we fill them live during the lab. It standardises outputs so editorial and commercial teams can compare products later.
| Field | Example |
| Product | Brand X Smart Speaker |
| Perceived Value (1–10) | 8 |
| Onboarding Friction (1–10) | 4 |
| Content Yield (clips/minute) | 0.5 |
| Price vs Avg | +15% |
| Trust Signals | Warranty, Brand |
| Likelihood to Recommend | 7 |
| Predicted Affiliate Conversion (% | 1.4% |
How I translate scores into a predicted conversion rate
I use a simple weighted model that I’ve calibrated against past launches. You can tweak weights to match your audience. For quick labs I apply these weights:
- Perceived Value: 35%
- Onboarding Friction: 20% (inverted)
- Content Yield: 15%
- Price Delta: 15% (penalty if pricier)
- Trust Signals & LTR combined: 15%
Example: Perceived value 8/10 = 0.8 * 35 = 28 points. Onboarding friction 4/10 invert to 6 => 0.6 * 20 = 12 points, etc. Sum the weighted points and map to a baseline category conversion rate (e.g., small consumer electronics baseline 1%). If total points are 80% of the max, predicted conversion = baseline * (1 + 0.8). So 1% * 1.8 = 1.8%.
What to capture on video
Video is the fastest way to judge “content readiness.” Capture these moments:
- 0–30s hero demo: one-shot product highlight that can be used as thumbnail or short reel.
- Setup timelapse: shows onboarding speed and friction.
- Anchor shot for scale: product next to a common object so viewers understand size.
- Problem/solution clip: demonstrate one core benefit solving a real pain point.
If you can produce a 15s and 60s cut within the session, that’s gold for affiliates — they’re far more likely to promote something they can publish instantly.
Common mistakes and how to avoid them
- Over-testing niche features — Focus on the 20% of features that deliver 80% of purchase intent.
- Letting one team dominate — Balance editorial excitement with commercial scepticism. The tester should flag problems even if the host loves it.
- Ignoring price context — A brilliant product at a bad price converts poorly; always benchmark to alternatives.
- Skipping content capture — If affiliates can’t create assets quickly, many will skip promoting even good products.
Example: how this worked for a recent launch
We tested a new pair of wireless earbuds from Brand Y. In two hours we found: fast pairing (low friction), excellent voice pickup (big perceived value for calls), but middling battery life and a price premium. Content yield was high because the case and earbuds photograph well. Our weighted model predicted a conversion of ~2.2% against a category baseline of 1.2% — we used that estimate to prioritise the launch in our affiliate campaigns and allocated higher CPMs to creators who could produce a hero 15s clip. Results: in week one the product converted at 2.0% on placed links — close enough to our lab estimate to be actionable.
Tools and templates I use
- Spreadsheet: Google Sheets with weighted scoring and auto-mapped conversion prediction.
- Capture: iPhone/Android + Rode mic, or a simple Elgato capture if testing a TV/gaming device.
- Editor: CapCut or Premiere Rush for 15/60s cuts inside the session.
- Note-taking: Otter.ai for quick transcription of tester commentary (surprising gold for quotes).
Run these labs weekly during a launch cycle and you’ll build a library of standardised, comparable data. That library is where the real value lives — it lets you spot category-level patterns (e.g., what onboarding friction score consistently kills conversion) and refine your weighting for better predictions over time. If you want, I can share a basic Google Sheets template and a short checklist you can use to run your first two-hour lab — say the word and I’ll drop it over.